

Manufacturing is an intricate process where even the smallest oversight can lead to significant costs. One of the most critical metrics that manufacturers need to monitor is the Cost of Quality (CoQ). While it might sound like a measure of how much quality costs, it’s more about the cost of poor quality. This includes expenses such as those related to goods returned and rejected, subpar materials, assembly errors, internal damage during assembly, and packaging mistakes leading to shipping damage, etc.
Understanding and accurately calculating CoQ is essential for manufacturers who aim to maintain high-quality standards while keeping costs down. While quality cost measurements and procedures can be successful, some costs of quality evaluations can go wrong. These problem areas can hurt an organization’s quality cost program. We’ve outlined a few of these often unconsidered CoQ costs that can lead to mistaken CoQ reporting.
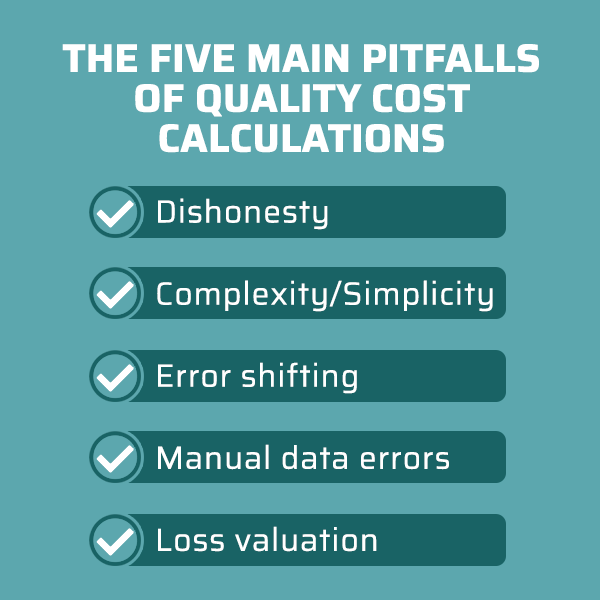
Dishonesty
The idea of zero mistakes may incentivize some personnel to misreport quality errors—the organization’s systems reward employees for making few or no mistakes. Employees may avoid reporting the mistake altogether if the system holds errors against employee performance.
SOLUTION
Organizations that honor employees for good performance at select times while also working with them without threats or penalties to discuss quality errors with a focus on solutions can reduce dishonest reporting. Alternatively, incentivizing workers to reduce quality costs (both process and implementation) is a realistic way to keep these issues in a simple framework.
Access instant peer survey results with our mini cost of quality survey.
If you still need to register to use our Cost of Quality Benchmarking Tool, click here.
If you have already registered for the tool, click here.
Complexity and simplicity of systems
If a Cost of Quality management system is too complex or too simple, the program may not align with organizational goals or objectives. In an overly complicated design, possibly only a few personnel are knowledgeable enough to use it, and system-savvy workers may conceal or dishonestly misreport quality costs. However, if measuring quality costs is too simple, quality managers may need more data or detailed information to correct problems.
SOLUTION
Organizations should ensure that systems align with goals and the company’s current position. These goals can inform the level of detail needed in an organization’s quality cost. A best practice is to keep systems as straightforward as possible while emphasizing transparency among relevant stakeholders. While custom software exists to track and report quality costs, a simple spreadsheet can be a starting point for elevating the Cost of Quality issues.
Error shifting
Error shifting involves costs found in one department that are moved or identified as if workers found these costs in the department of their origin. Shifting an error or cost may incentivize employees to move problems into areas they aren’t responsible for, discouraging any employee interest in solving problems or their primary causes.
SOLUTION
Frequent communication with employees within each process of making a product can maintain transparency and lead to more rapid error correction, even within complex processes.
Additionally, organizations should consider adopting a method of distinguishing significant mistakes from more frequent, less impactful errors. Regular meetings with at least one team member from each discipline can break down these silos. Starting with a pilot program focused on a very narrow set of parameters is often an excellent way to start this process.
Manual data errors
Quality data errors can appear in any system, misrepresenting the actual quality costs and requiring manual correction. While manual corrections may seem quick and low-cost, some workers may simply guess the correct values or even remove erroneous data. Over time, the organization may need to learn how many corrections or what kind were made, producing a misleading Cost of Quality report.
SOLUTION
Reducing manual data entry errors includes placing restrictions on allowable corrections at the beginning of the process, informing management how often what kinds of errors are corrected, changing or replacing outdated or malfunctioning systems, and frequent re-training of employees to promote competence. More advanced tools like SPC, layered process audits, quality auditing software, and process mining can also help reduce errors.
Loss valuation
Loss valuation refers to the lost value of the components used to make the product. Not only are the parts costly, but they also need to consider the cumulative worth of the final product’s total cost. Moreover, loss valuation includes labor and material costs and “soft costs” like customer satisfaction and reputation.
SOLUTION
Discovering early in-process losses during each stage of a product can significantly reduce quality costs. Organizations should also consider creating a process to estimate the upstream component and material losses and downstream metrics like goods returned and rejected (GRR) and assign values to “soft costs” like reputation.
The CoQ Mitigation Process
Besides investigating the items above, having a clear CoQ measurement, reporting and improvement process is essential. Here are a few basic items that most organizations build into their approaches:
- Clearly Define ‘Quality’
Before you can calculate the cost of quality, you need to define what ‘quality’ means for your organization. Is it zero defects? Or is it meeting specific industry standards? Having a clear definition ensures that you’re measuring the right things. - Categorize Costs Properly
CoQ is typically divided into two main categories:
Prevention Costs: Costs incurred to prevent defects, like training, quality planning, and preventive maintenance.
Failure Costs: Costs associated with defects that are found after the product reaches the customer, such as returns, repairs, and warranties.
Mistaking one for the other can skew your calculations, so ensure that each cost is categorized correctly.
- Don’t Overlook Hidden Costs
While some costs, like returns and repairs, are obvious, others might be hidden. For instance, a damaged reputation due to poor quality can lead to lost sales, which is a cost that’s harder to quantify but equally important. - Regularly Update Your Data
The manufacturing process and the associated costs can change over time. Regularly updating your data ensures that your CoQ calculations remain accurate and relevant. - Invest in Training
Human errors, whether in assembly or packaging, can significantly impact the CoQ. Regular training sessions can help reduce these mistakes, leading to a more accurate representation of quality costs. - Use Technology
Modern manufacturing technologies, like Quality Management Systems (QMS) and Enterprise Resource Planning (ERP) systems, can help track and calculate CoQ more accurately. They can also provide insights into areas of improvement. - Review Supplier Quality
Poor material quality can lead to increased CoQ. Regularly review and assess your suppliers to ensure they meet your quality standards. - Consider the Entire Product Lifecycle
The cost of poor quality isn’t just about the manufacturing process. It extends to the entire product lifecycle, from design to disposal. Ensure that your CoQ calculations consider costs incurred at every stage. - Encourage Feedback
Feedback from employees on the shop floor can provide valuable insights into potential quality issues. Encouraging a culture of open communication can help identify problems before they escalate. - Review and Refine
Lastly, always be open to refining your CoQ calculation process. Regular reviews can help identify areas of improvement, ensuring that your calculations remain accurate and actionable.
Conclusion
For manufacturers, the Cost of Quality is more than just a metric; it’s a reflection of their commitment to excellence. By avoiding common mistakes in CoQ calculations, manufacturers can gain a clearer understanding of where quality issues arise and take proactive steps to address them. This not only helps in maintaining high standards but also in ensuring that the cost of achieving those standards remains sustainable.
If you still need to register for or use our Cost of Quality Benchmarking Tool, click here.
If you have already registered for the tool, click here.