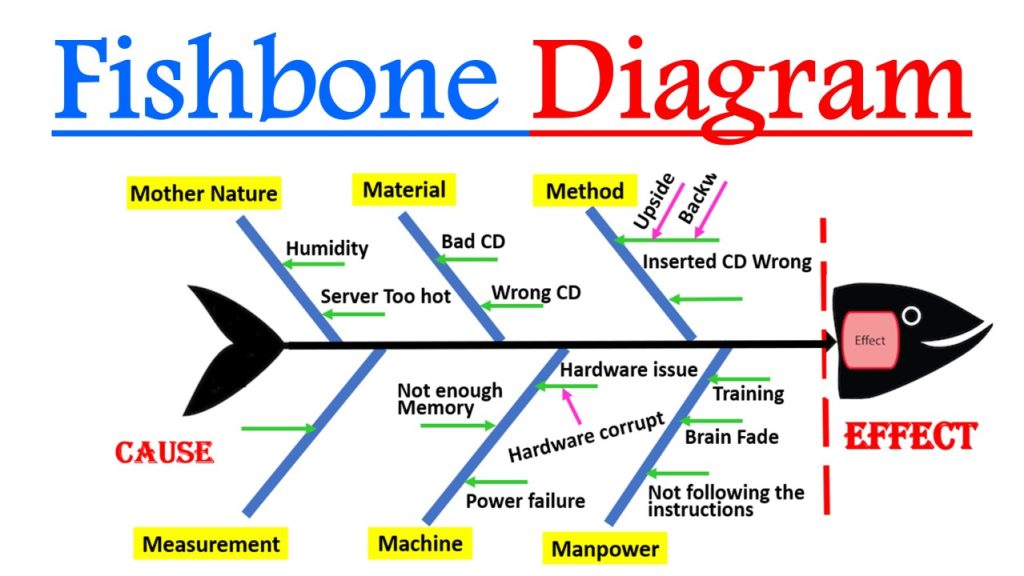
- Fishbone diagrams, also known as Ishikawa diagrams or cause-and-effect diagrams, are visual tools used to systematically identify potential factors causing an overall effect, particularly in troubleshooting and quality improvement sessions.
- The usefulness of fishbone diagrams lies in their ability to organize thoughts and foster teamwork while dissecting a problem.
- Fishbone diagrams are instrumental for quality management because they facilitate a structured brainstorming process to pinpoint and address the root causes of quality defects.
Fishbone diagrams, also known as Ishikawa diagrams or cause-and-effect diagrams, are visual tools used to systematically identify potential factors causing an overall effect, particularly in troubleshooting and quality improvement sessions. The diagram looks like the skeleton of a fish, where the problem or effect is the fish’s head, and the bones branching off the spine represent different causes contributing to the effect. These diagrams help teams focus on the root causes of a problem rather than symptoms, making them essential in quality management processes.
The usefulness of fishbone diagrams lies in their ability to organize thoughts and foster teamwork while dissecting a problem. They are especially valuable in a quality management context because they encourage a detailed examination of all possible causes of a quality issue. This could include methodologies, machinery, people, materials, measurement, and the environment. By breaking these categories into sub-causes, teams can dive deeper into the problem, ensuring no stone is left unturned. This methodical breakdown helps identify areas where improvements can be made to prevent future issues.
Fishbone diagrams are instrumental for quality management because they facilitate a structured brainstorming process to pinpoint and address the root causes of quality defects. This helps create a more efficient quality control system and optimizes operational processes, reducing waste and enhancing customer satisfaction. By using fishbone diagrams, quality managers can drive continuous improvements and maintain compliance with industry standards, ensuring that the final products meet quality expectations consistently. This tool, coupled with methodologies like Six Sigma’s DMAIC framework, can significantly improve a company’s quality outputs, making it a staple in the quality management toolbox.


Leave a Reply
You must be logged in to post a comment.